How It Works
Every section of a Cheat Sheet explained. What it shows and how to read it quickly before kick-off.
Full sheet overview
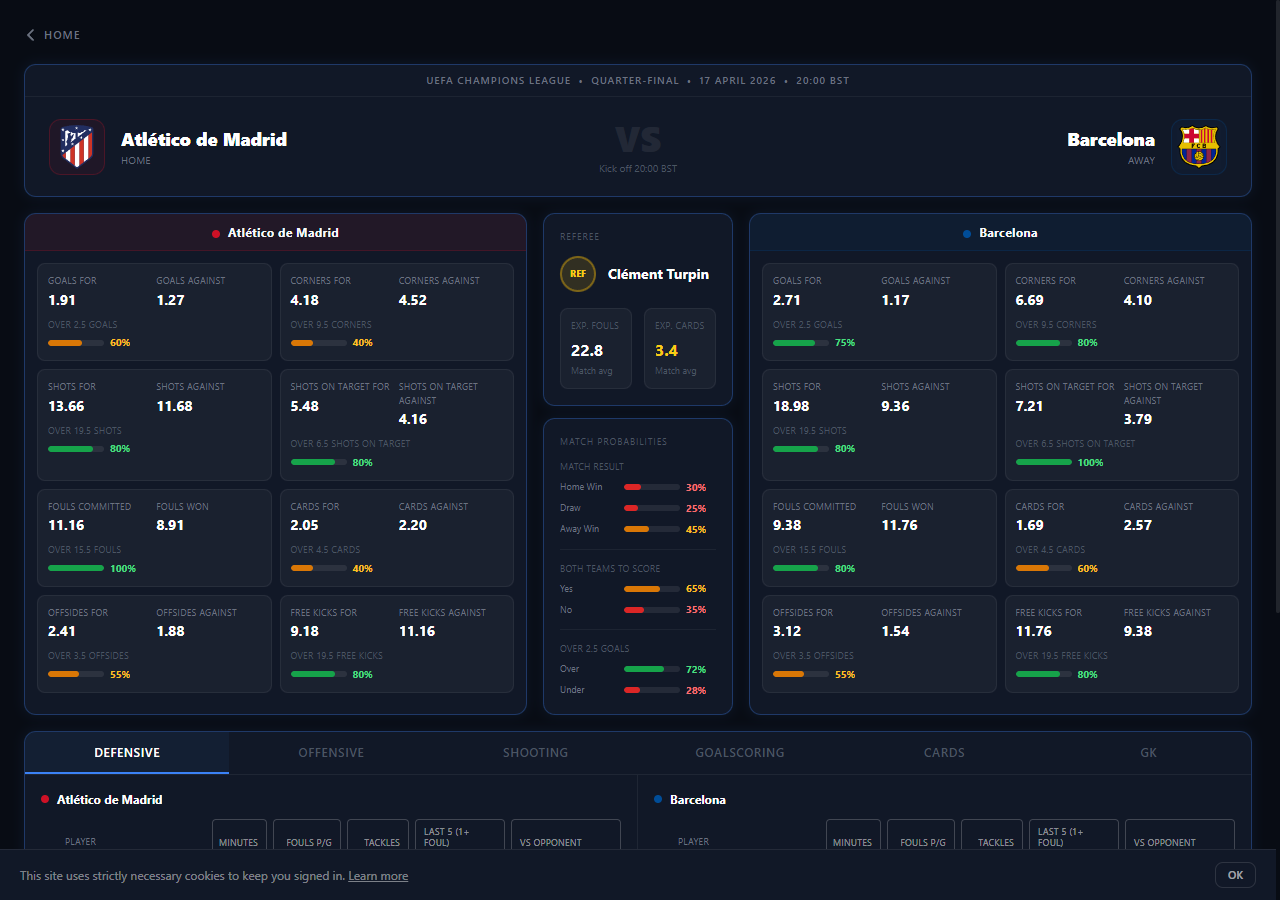
Example: Atlético de Madrid vs Barcelona, UEFA Champions League Quarter-Final
Match Header
The strip at the top confirms the competition, round, date, and kick-off time. Team names and official club crests are shown for home and away sides.
Team Stats Boxes
The two large panels show 15 key stats for each team, calculated from the confirmed starting XI. Goals for and against are averaged from the team's last 10 completed matches. All other stats (corners, shots, fouls, cards, offsides and free kicks) are season averages. Every stat card includes a market line and a probability bar showing how often that team clears it.
Goals For / Against
Average goals scored and conceded per game, based on the last 10 completed matches. Shown alongside an Over 2.5 Goals market bar.
Corners For / Against
Average corners won and conceded per game. Market line set at 9.5 total corners.
Shots For / Against
Total shots and shots on target averages. Markets shown for Over 19.5 shots and 6.5 on target.
Fouls Committed / Won
Average fouls per game, both committed and drawn. Market at 15.5 fouls.
Cards For / Against
Average yellow and red cards per game. Market line at 4.5 cards total.
Offsides / Free Kicks
Average offsides caught and free kicks conceded. Markets at 3.5 offsides and 19.5 free kicks.
Referee Box
The centre panel shows the assigned referee, plus the fouls and cards you can expect in the match, based on both teams' averages per game this season. When no referee has been named yet, the name reads N/A and the numbers are marked Team avg.
Match Probabilities
Three markets shown as probability bars: match result, both teams to score, and over/under 2.5 goals. Match result percentages use bookmaker odds where available, with the overround removed. Goals and both-teams-to-score probabilities are derived from statistical modelling based on each team's goal averages. All outcomes within each market sum to 100%.
Match Result
Three-way outcome percentages for the full 90 minutes.
Both Teams to Score
Probability that both teams get on the scoresheet.
Over 2.5 Goals
Probability of 3 or more goals being scored in the match.
Player Tables
Six tabbed views, one for each player market. Both starting XIs are shown side-by-side, ranked by the key stat for that tab. Player names are colour-coded by recent form: green means in form, red means cold.
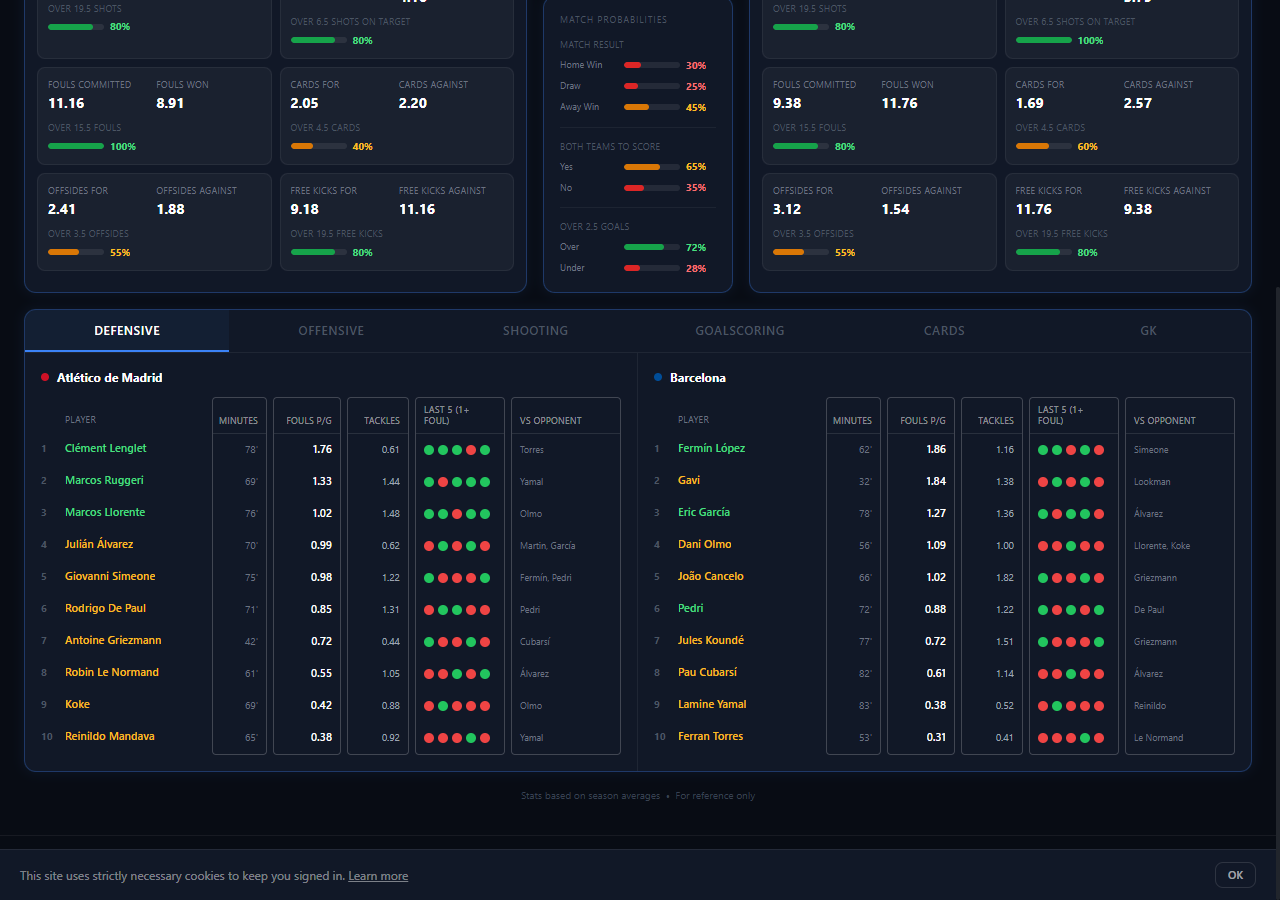
Defensive
- ·Minutes played
- ·Fouls committed per game
- ·Last 5 form dots (1+ foul)
- ·vs. today's opponent (historical matchup)
Offensive
- ·Fouls won per game
- ·Last 5 form dots (1+ foul won)
- ·vs. today's opponent
Shooting
- ·Shots on target per game
- ·Last 5 (1+ shot on target)
- ·Total shots per game
- ·Last 5 (2+ shots)
Goalscoring
- ·Season goals
- ·Season assists
- ·Goals + assists per game
- ·Last 5 goals dots
- ·Last 5 assists dots
Cards
- ·Games played
- ·Yellow cards
- ·Red cards
- ·Cards per game
- ·Last 5 (carded) dots
GK
- ·Saves per game
- ·Last 5 (3+ saves) dots
Ready to use it?
Live sheets for every major competition, free. Just create an account.